What is Open Telemetry and How can it Help Me?
If you work in the field for any substantial amount of time, you most likely have asked yourself the question "How do I know what is going on with my applications at any given time?". If you are lucky, then this question is coming up as a proactive topic as you get ready to deploy something. If you are unlucky, you may be asking this question after you have an outage or SLA breach. If you have ever asked this question before, then Open Telemetry can probably help you.
Observability
The answer to the question above is Observability. This word is currently a huge buzzword in the industry but also one that is somewhat of a mystery. I often times run into customers asking the question "What is the difference between Observability and Monitoring?". This is a great question and I find myself answering it differently almost every time it is asked. It can be summed up like this in my opinion.
- Monitoring allows a team to know that an issue is occurring and be alerted of that fact.
- Observability allows the team to then find the root cause of that issue and hopefully prevent it in the future.
So while, monitoring is a foundation of Observability, it is not the whole solution.
For Example:
Let's say you have some VMs running and you detect high CPU utilization using a monitoring tool. This is great information to be alerted of but the next question is "Why does the Virtual Machine(VM) have high CPU utilization?". In order to answer that, we would need to dive into system or application logs to see a more granular view of what was happening at the time of the problem. If this is a distributed system, we may also need tracing so we can see if the issue actually occurred upstream. For example, maybe an upstream load-balancer is not functioning correctly and is therefore hammering the VM with more traffic than usual. The root cause of the issue actually has nothing to do with the VM, even if that was the component that first alerted the monitoring team.
Since we need to correlate this different data, it is useful to define what is widely accepted as the "Three Pillars of Observability"
- Metrics
- Traces
- Logs
At the time of writing, logs are not yet Generally Available (GA) in Open Telemetry.
What does Open Telemetry have to do with all of this?
These Observability concepts are not necessarily anything new. Prior to Open Telemetry, people were creating observable platforms and applications usually with the help of an observability vendor or open source library. Some examples in no particular order would be:
- Data Dog
- New Relic
- Splunk
- Nagios
- Prometheus
These observability providers are indeed still very popular for analyzing observability signals, but a problem comes up when you need to change from one vendor to another, or use multiple different vendors for different types of data. For example, maybe you want to use Splunk for logging, but use New Relic for Application Performance Monitoring and Tracing. Since these tools had unique SDKs and Libraries, it was often a huge effort to migrate from one to another or to use multiple different ones. This lead to a lot of development time and effort to create observable applications. This is the problem that Open Telemetry tries to solve.
Open Telemetry Concepts
The core value proposition of Open Telemetry is that it represents an open standard for telemetry data production and collection. This open standard data format(OTLP) is compatible with most modern observability and cloud providers. This means that you only need to instrument your application one time, and you can feel free to use whatever observability backend analysis tool that you wish. The following architecture (Courtesy of opentelemetry.io) provides a great birds-eye view of Open Telemetry:
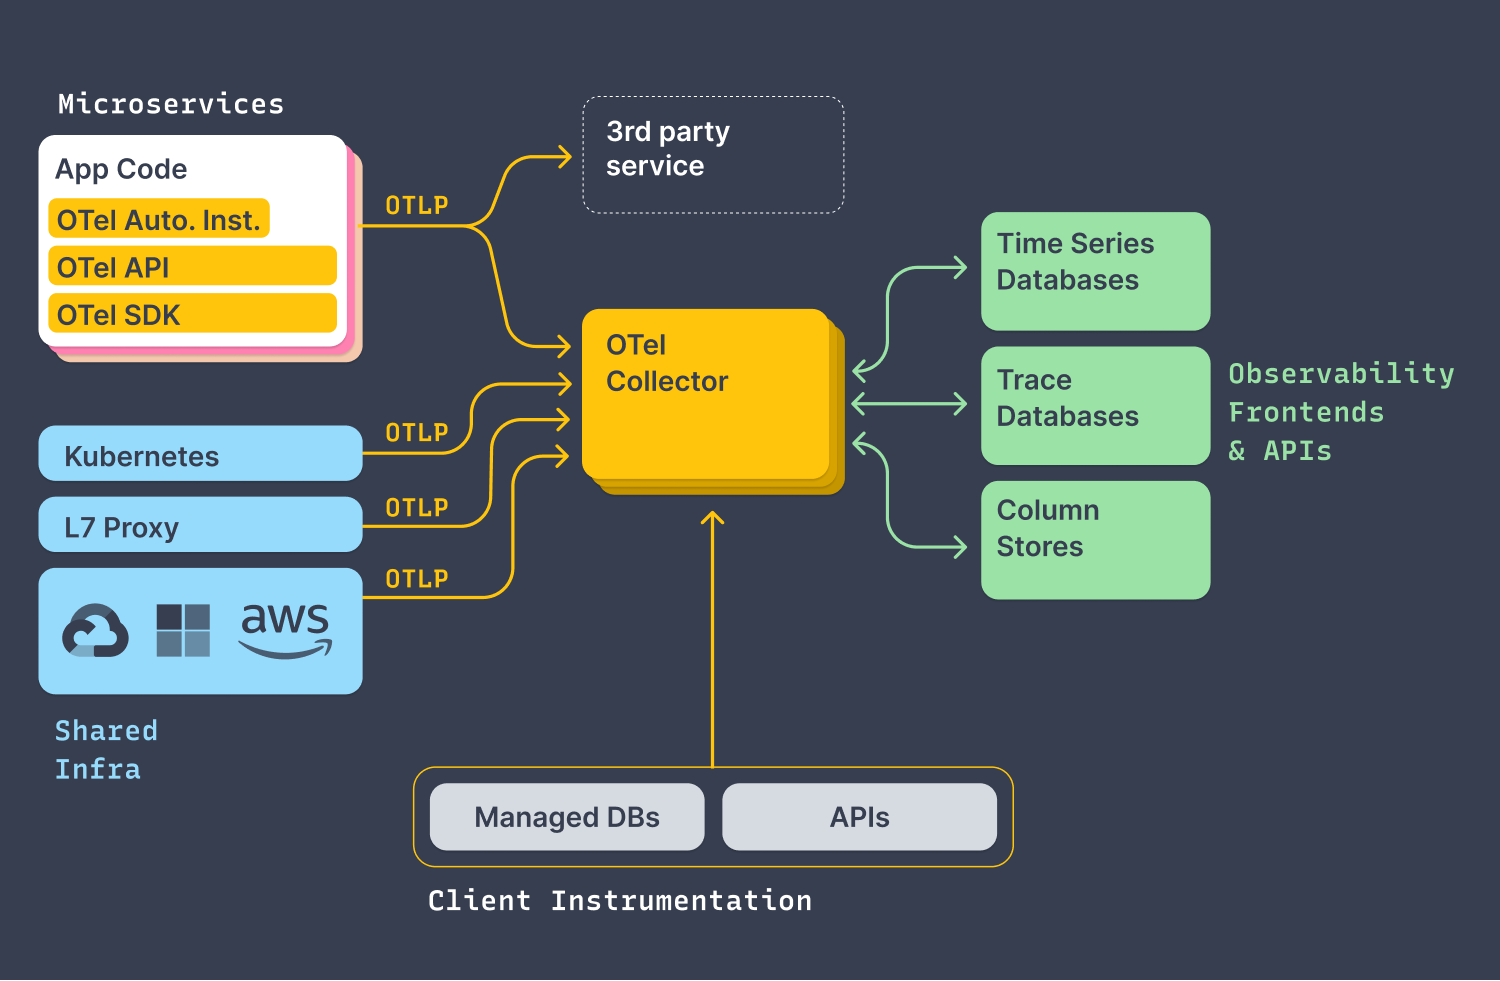
We can see on the left that telemetry data can be produced from a variety of different platforms, then collected with a central collector, and then exported to variety of different Observability analysis tools and backends.
A simplified example architecture would look something like this:
Kubernetes ----> OTel Collector ----> Prometheus
In this example we are collecting telemetry from kubernetes and exporting it to Prometheus.
To demonstrate a big benefit of Open Telemetry. Let's say in the future, instead of Prometheus, you want to send your logs to AWS CloudWatch. The architecture would now look like this:
Kubernetes ----> OTel Collector ----> CloudWatch
In this example we are collecting telemetry from Kubernetes and exporting it to CloudWatch
To perform the migration from Prometheus to CloudWatch, all you would need to do is change your Open Telemetry Configuration to export to CloudWatch, instead of Prometheus. Since we are using an open standard, the telemetry data is compatible with both Prometheus and CloudWatch.
Conclusion
If you are looking to think about an Observability strategy for the future it is important to consider how Open Telemetry can help you. Taking time to instrument applications and infrastructure to be compatible with Open Telemetry will ensure some level of future proofing to your architecture.
I hope you enjoyed this article as I expect it to be the first of many on the topic of Open Telemetry.